
THESE ARE THE METRICS YOU NEED TO TRACK FOR SOCIAL MEDIA SUCCESS
Do you promote yourself and your blog on social media?
Are you measuring the impact that’s having?
Wondering what social platforms you should pay the most attention to?
Today, I want to go through the top social media metrics you should be monitoring on Twitter, Facebook AND Instagram. This will help you see whether your social media marketing is working and what you can do to improve it. Let’s go.

#1 | FOLLOWER GROWTH
Evaluating your follower count for each individual platform is good, but putting it altogether is even better.
Combining your total amount of followers across your channels tells you the exact number of unique people that are interested in your brand. It’s your job to try and consistently grow that number. The more new followers you get, the more they’re engaging with your content, which means you need to share things that will attract people.
How to track it
When it comes to Facebook, it’s all about page likes, and you can get a detailed breakdown of these in Facebook analytics. On your page, head to Insights and then click Likes in the left-hand column.
The first bit of info will show you your total amount of likes, plus you can compare how many you’ve lost or gained during a set amount of time. So if you’re evaluating this at the end of every month, you can see your growth during that specific period. This lets you see how your fans are reacting to certain posts and different campaigns, and also what time it’s best for you to target them.

On Twitter, it’s easy – just head to your profile to see your total amount of followers.
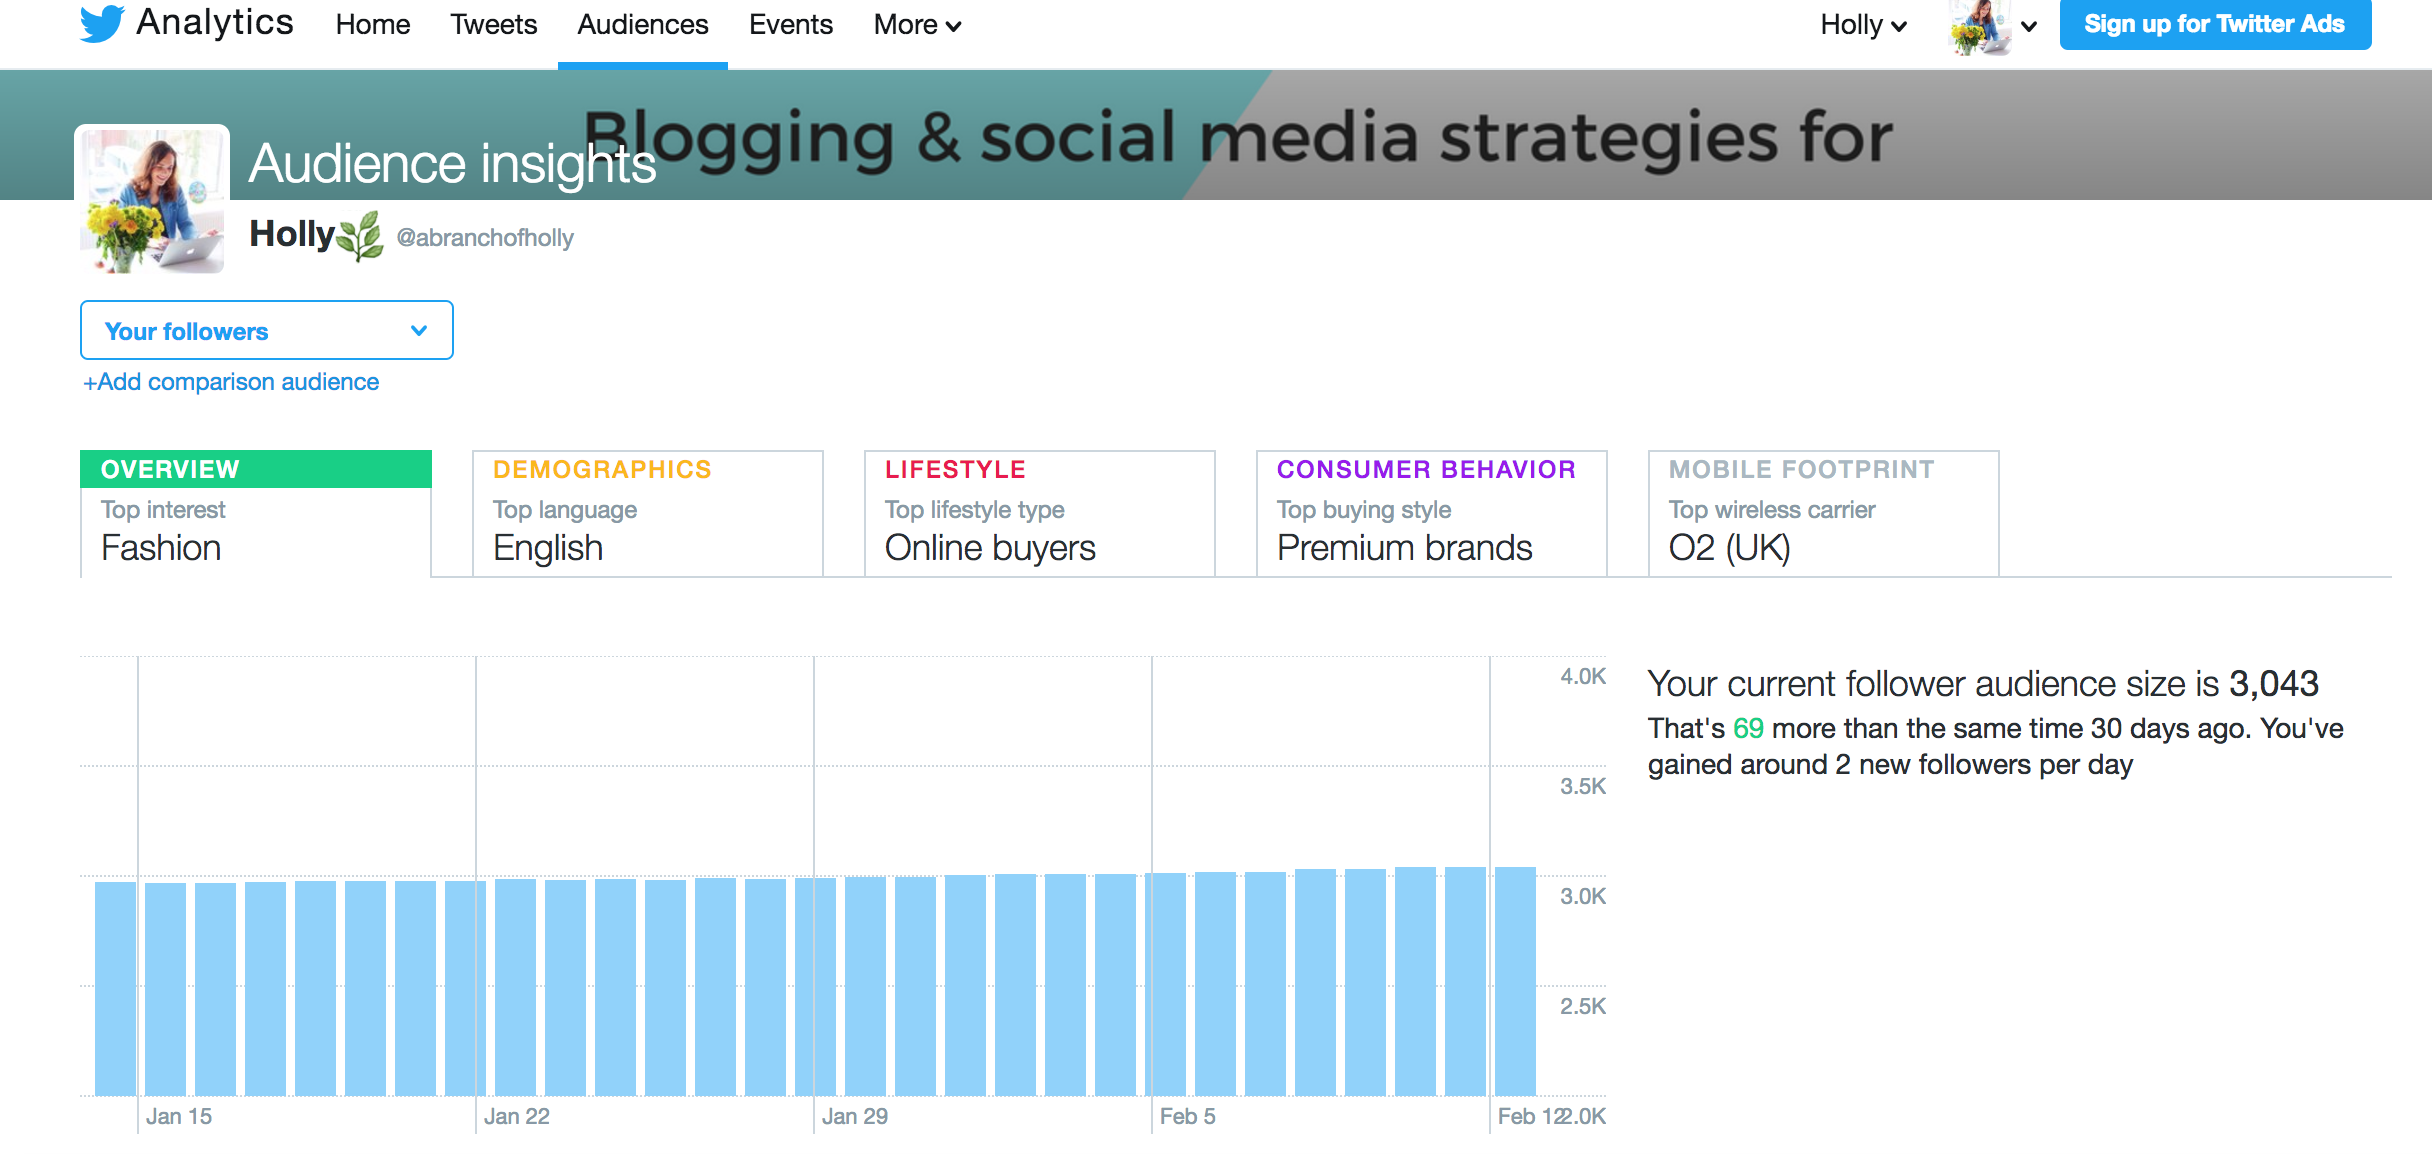
If you want to see how much your following has grown or find out more about the people that have followed you, just head to your Analytics dashboard within Twitter.

At the top, you’ll always see a 28-day summary with key bits of info and your follower growth will be shown at the right-hand side. This will also show you different trends for recent followers and you can track back to previous months too, which is really helpful.
Instagram used to be tricky until they introduced their own insights. But you’ll only be able to access these from your phone or tablet, not the desktop version.
Go to your profile, then at the top click what looks like a little bar chart next to your settings. To see your followers, scroll down to the "Followers" graph and hit See More. This will tell you how many followers you’ve currently got, plus how many you gained during a weekly period.

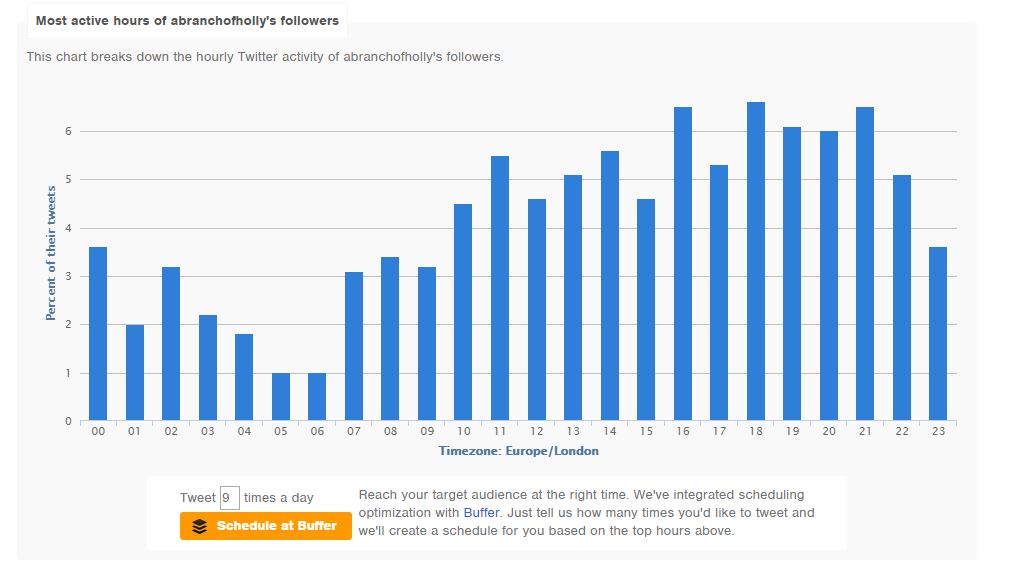
#2 | FIND OUT WHEN YOUR AUDIENCE IS MOST ACTIVE
It won’t surprise you that I mention this point in almost every social media article I write!
Knowing when your audience is most active online is SO crucial. It helps you create your own unique posting schedule, so you can post content at times when you know you’re going to get the most engagement. Genius.
How to track it
Optimal times for Facebook can be found in Insights and you can view your followers’ daily activity over the past week. Updating these times each week is probably the best frequency to start with. You can also narrow it down to different days so you can see how the activity changes in even more detail.
When you’re in Insights, head to Posts down the left-hand side and make sure that at the top you select When Your Fans Are Online. Then you can hover over the different times of the day to see when your audience is most active and make a note of the two most optimal times for each day.

Twitter is a little different as the Analytics don’t really give you a detailed breakdown of this like Facebook does. You can see how your engagement fluctuates – click the Tweets tab to see this - but for your optimal times you want to use another tool.
I use Followerwonk and I’ve written a whole tutorial on how to find your optimal times here.
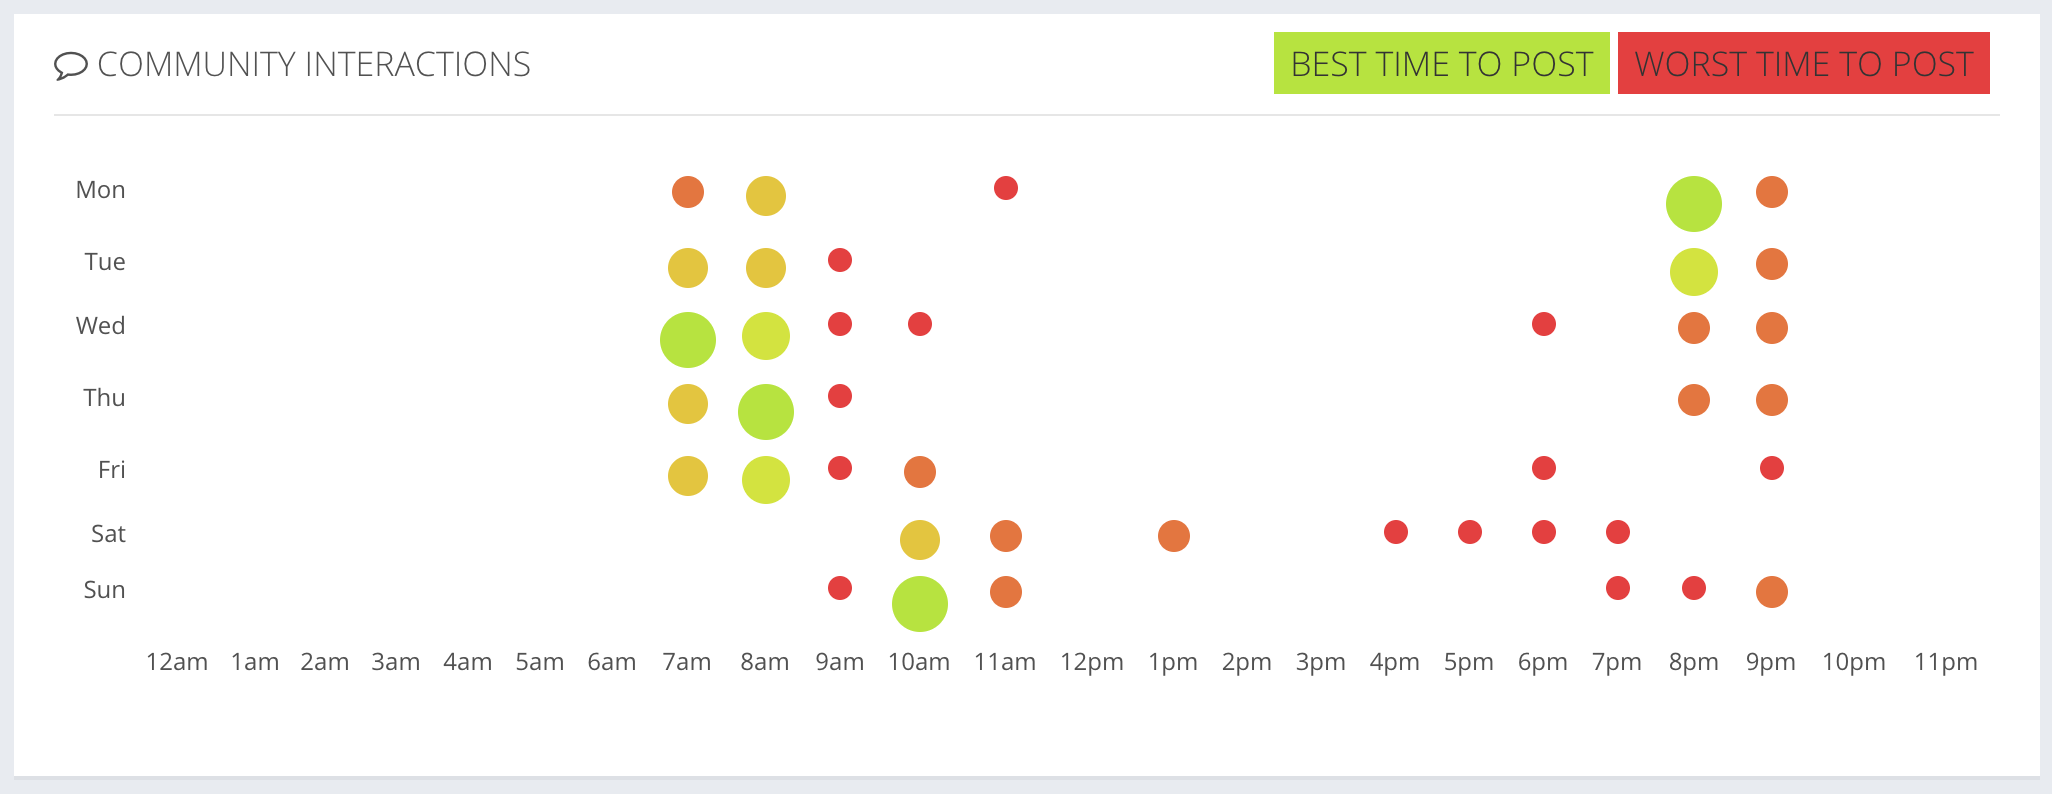
Again, with Instagram, you want to use an external tool. The one I used to use called Iconosquare isn’t free anymore, but I’ve found a fab alternative.
Squarelovin is free to sign up to and gives you a detailed breakdown of all your Instagram analytics. To find out when your best times to post are, head to Optimisation in the left-hand column, then scroll down until you see the graph that looks similar to this one below. The green circles are the ones you want to make a note of – hover over them and they’ll give you an exact time.
#3 | TRACK LIKES AND FAVOURITES
Whatever you share on social media as part of your marketing strategy, it’s important to monitor how your audience reacts to it. This helps you determine a lot of things, like:
- If your audience is interested in the content you’re currently sharing
- What type of content you should share in the future
If you’re just sharing one type of content that’s not getting any engagement, you need to think about cutting it out of your calendar or think of another way you could share it, for instance, through another channel.
How to track it
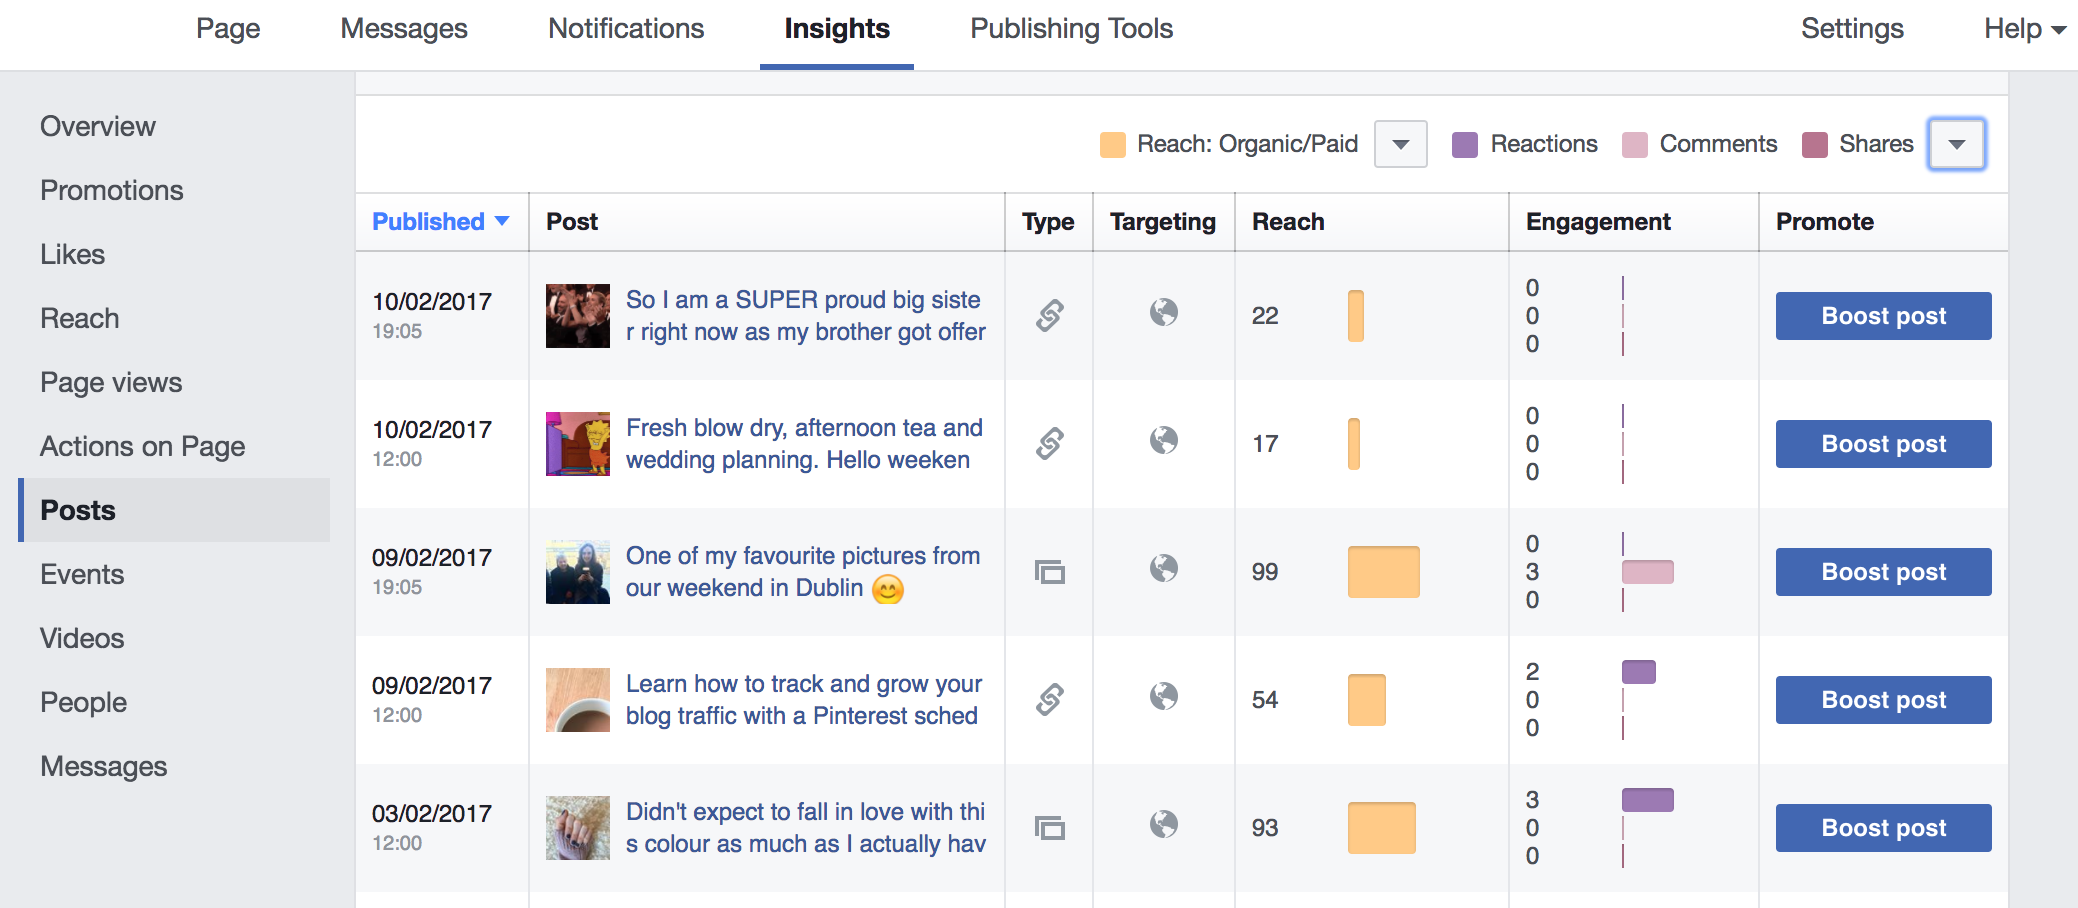
Now Facebook has updated its reaction system, it means they’ve got a lot more data on it too. You can see not just if your fans have liked your posts, but if they’ve loved them, disliked them or even gotten upset by any of them.
To get this info, head to Insights, click on Posts, scroll down to all your published posts and from the drop down menu, click to view Reactions/Comments/Shares.
If you want to look at this in more detail for each individual post, just click on the post link to view the breakdown of reactions.
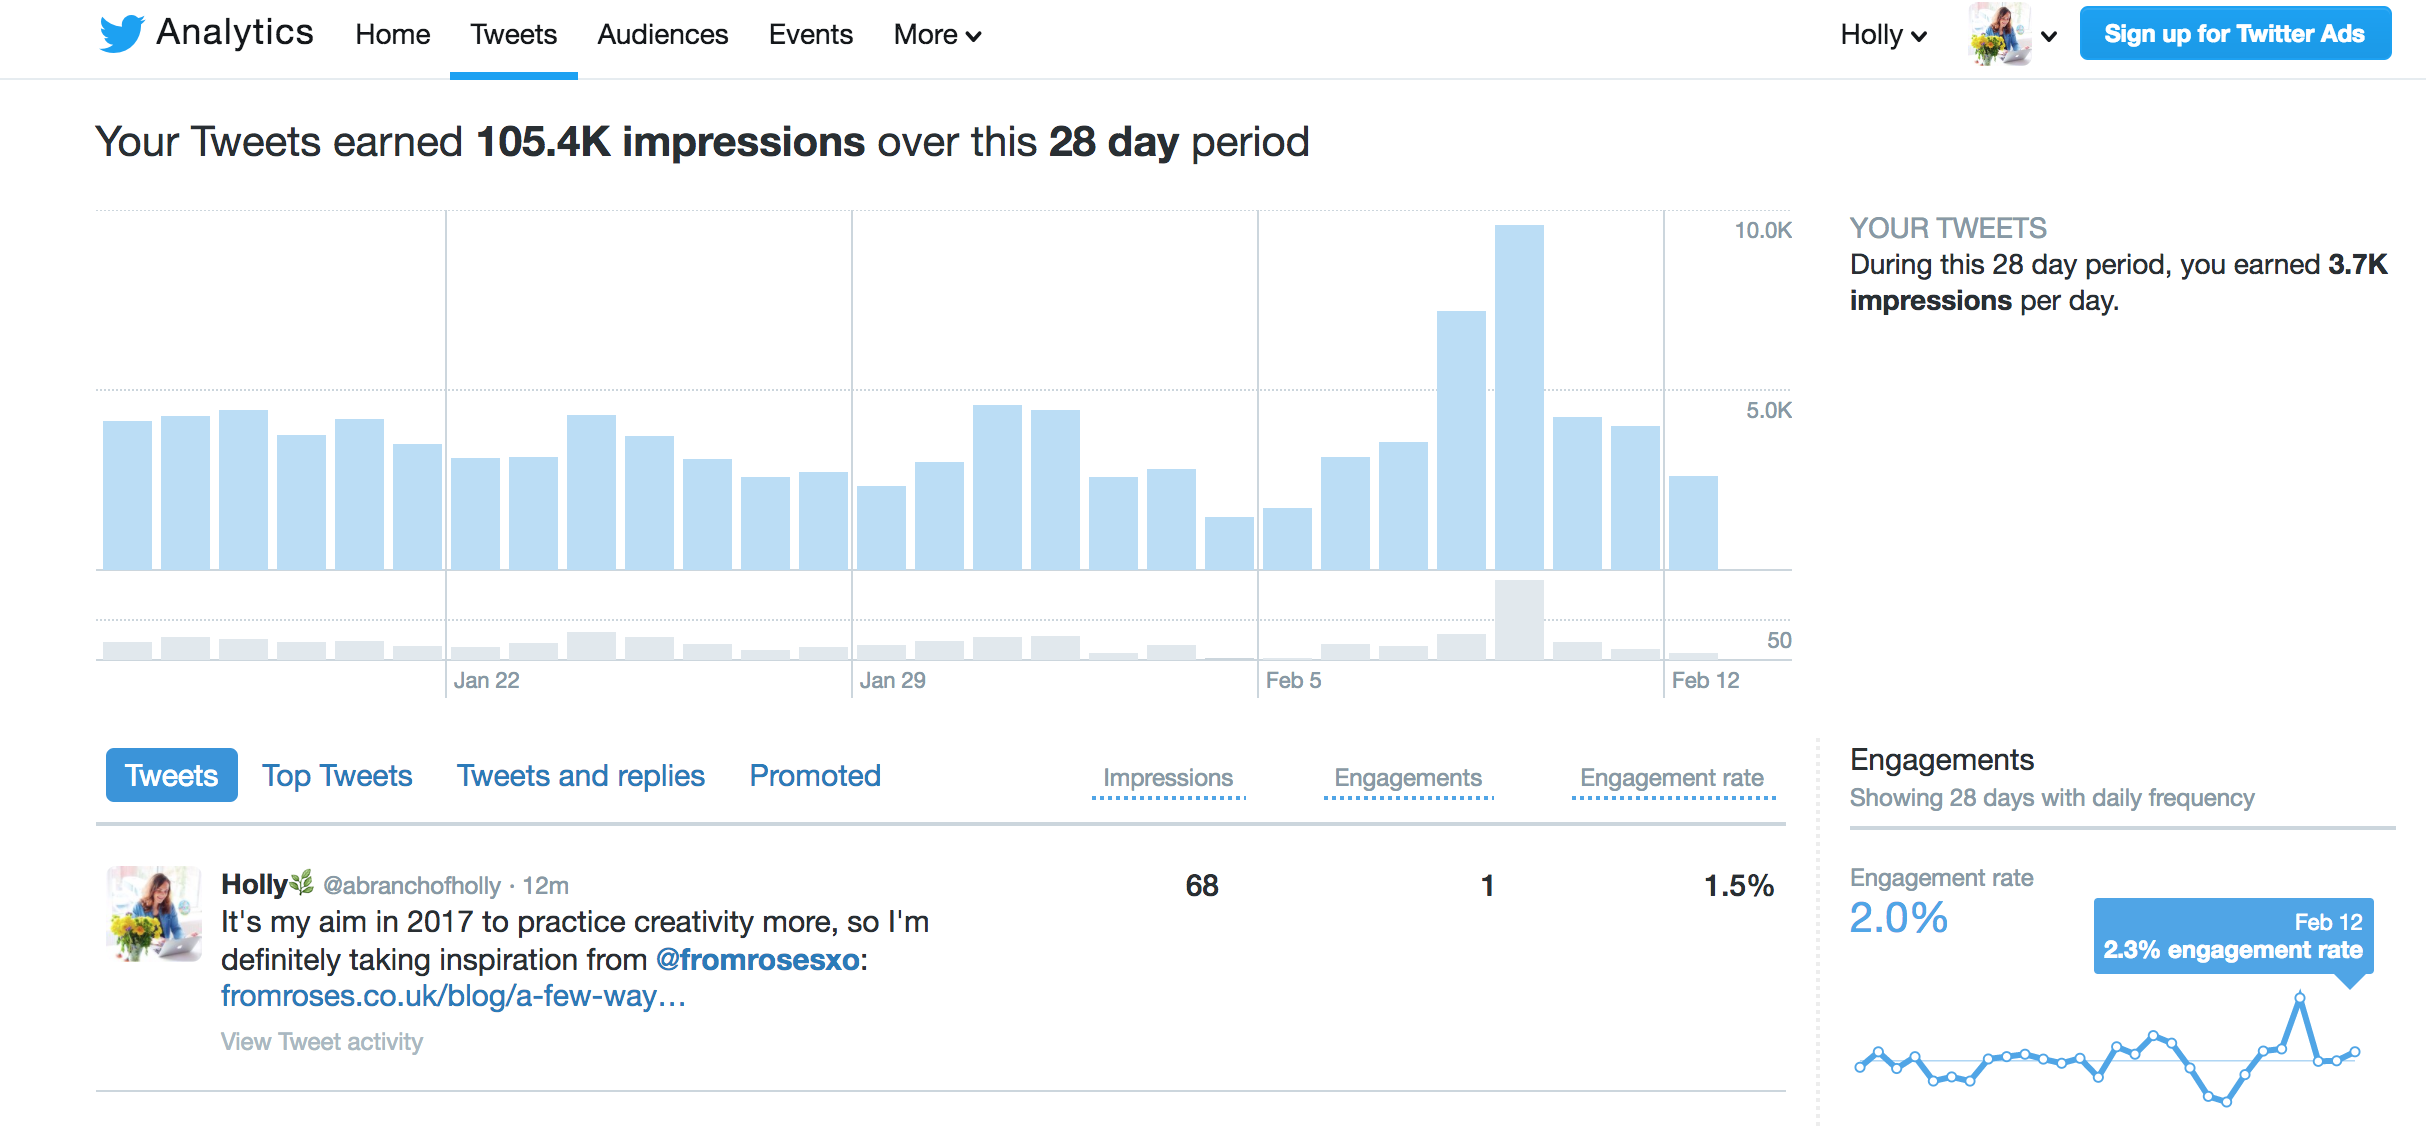
Twitter works in a similar way by showing you a whole list of your tweets within a certain amount of time. When you’re in your Twitter Analytics, head to Tweets and all the data you need will be on the right-hand side. You can also just view your Top Tweets to give you ideas for future content!

The Engagement columns give you a hell of a lot of information. If you’re just looking for something in particular, for instance, Likes, scroll down the right hand side until you see that graph. It shows you how many likes you got within that 28-day period, plus your average amount of daily likes as well as for each day.

Squarelovin makes it SUPER easy to see your Instagram likes over time. It shows you your data across a massive chunk of time, but you can hover over each line in the graph to see data from just one month. Head to Engagement and look at the top graph. You can also scroll down to see your Most Liked Media Ever to see which of your pictures perform the best.

#4 | WHO IS TALKING ABOUT YOUR BRAND
If your people are out there talking about you and what you have to offer, then you want to be a part of that.
How to track it
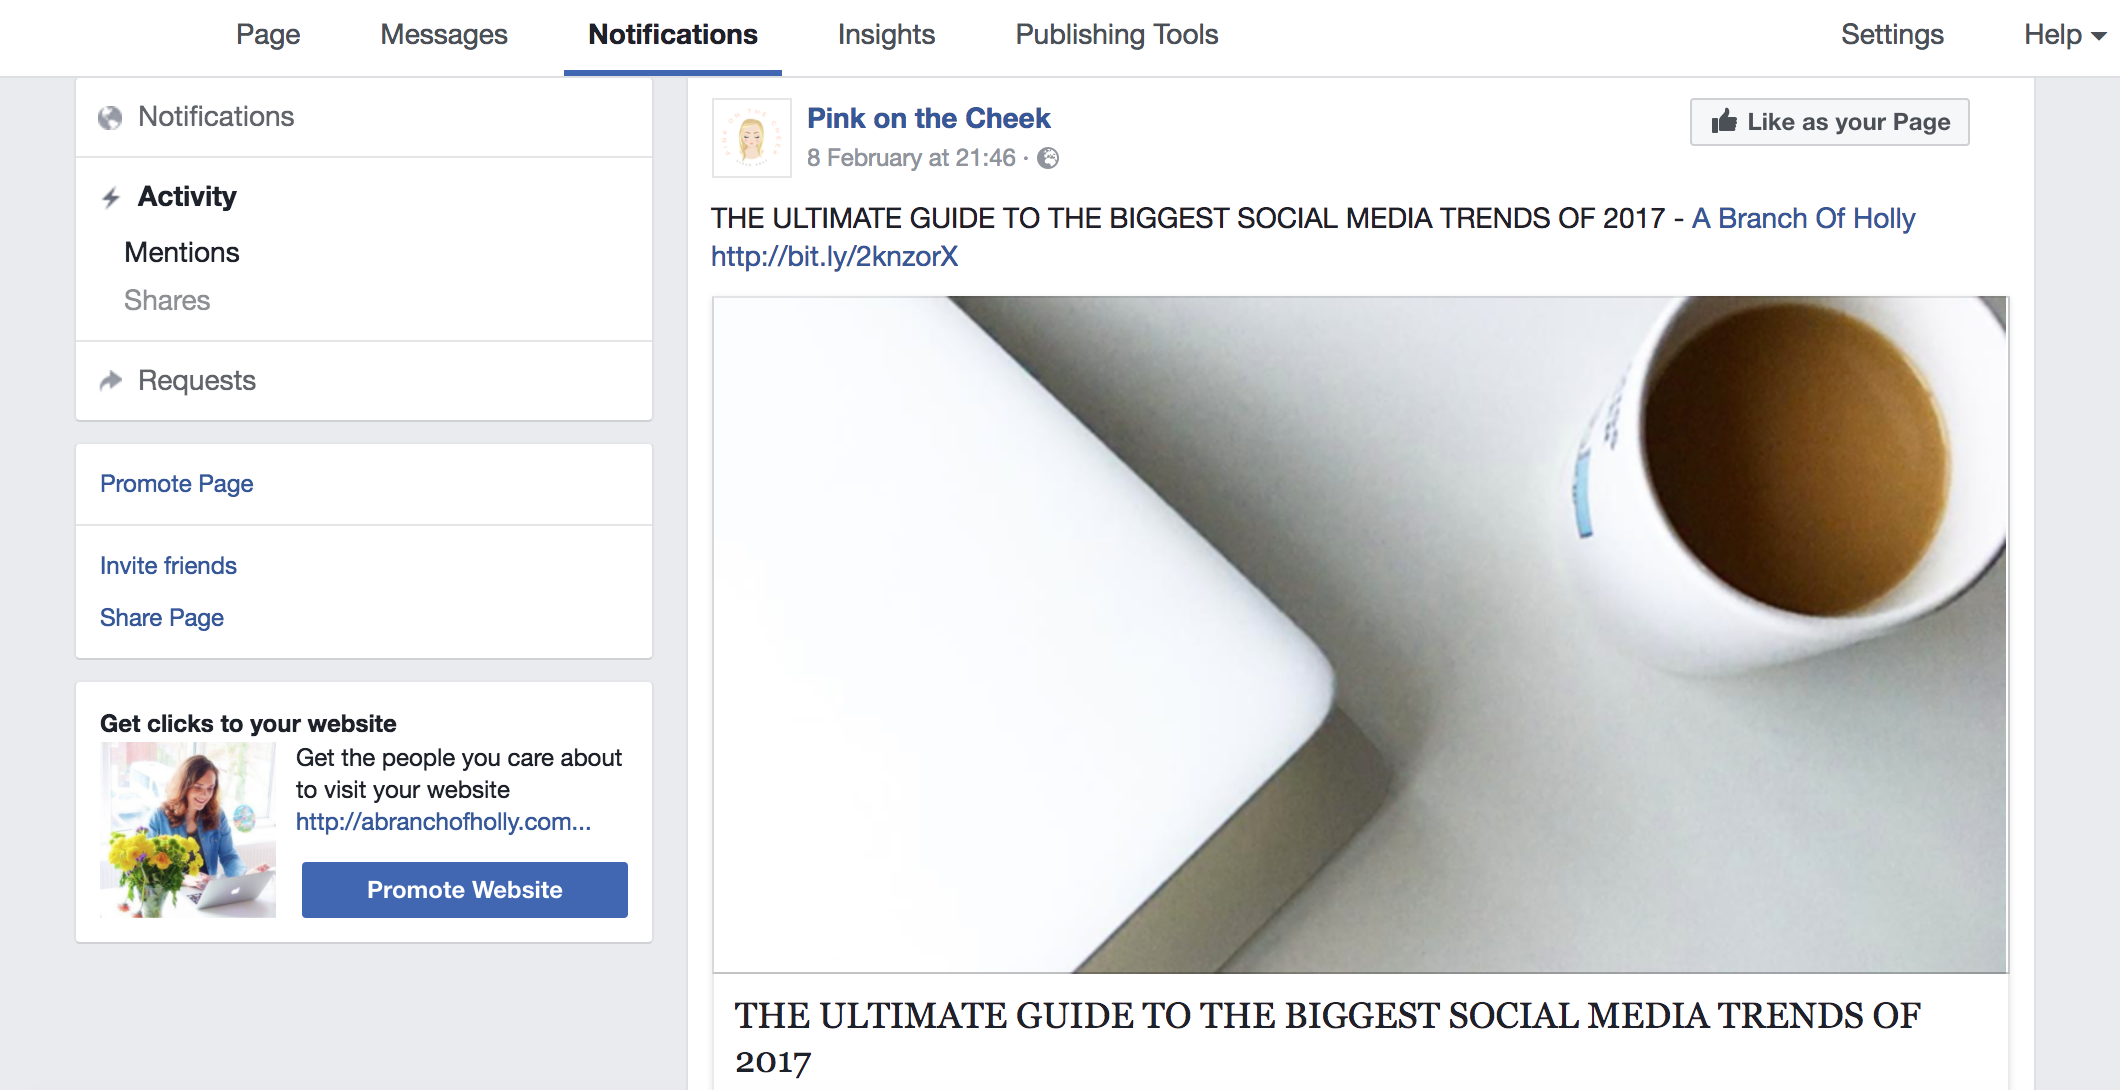
On Facebook, you’ll get a notification whenever someone tags you in a post, whether it be your personal profile or business page.
You can only see your mentions on Twitter when someone directly tags you with your username (e.g. @abranchofholly). If you want to keep an eye on what’s happening even when people @ you but still mention you, you can set this up no problem.

On Squarelovin, it gives you an overview of your comments on your dashboard, but to see them in more detail, head to Engagement and scroll down to the graph called Comments Received. Underneath that, you’ll also be able to see your most commented pictures ever.

#5 | FIND OUT MORE ABOUT YOUR AUDIENCE
One of the most important things about growing your following on social media isn’t just about how you target people – it’s knowing WHO you’re targeting. This info can really help improve your overall strategy, including content ideas, wording and more.
How to track it
You want to head to your Insights when you’re in Facebook and scroll down to People in the left-hand side. This will tell you the age, gender and location of your fans.

It’s super easy to find out information about your audience on Twitter. When you’re in Analytics, head to Audiences to get what you need.
This tool is great because it really gives you a complete overview of your followers. You’ll see things like Interests, Language, Gender, Mobile Device and more. But to get even more in tune with your audience on Twitter, the best thing to do is interact with them.
Squarelovin won’t give you too much information about the people who are following you on Instagram. Head to the Community tab and you’ll be able to see the difference between how many people are following you, compared to how many you’re following.

#6 | HOW MANY PEOPLE ARE YOU REACHING?
Reach is a really useful metric to keep an eye on. It combines not just people you’ve reached within your audience, but also people outside it too. If people engage with your content, they share it with their followers and that increases your reach.
So let’s say someone shares your blog post on Twitter and they’ve got 1,000 followers. That’s potentially 1,000 extra people who would see your content. Get it?
The way to improve your engagement is to include more engaging content within your social strategy.
How to track it
When you’re in Insights, go down the left-hand column to the Reach tab. The first big graph shows you your post reach, which essentially means how many people saw your post.
If you scroll down to the bottom, you’ll see another graph and that shows you your total reach. This includes everyone who saw any activity on your page, like fan interactions, mentions, adverts and so on.

When you’re looking at Post Reach, you see click on any day to see how big your reach was.
On Twitter, you want to go back to Tweets and in the big table, there’ll be an Impressions column. This will show you the number of impressions for each tweet. The more people engage with your tweets, the higher your impressions will be.
For this information, you want to go straight to Instagram’s own analytics. In the top banner, it’ll show you how many impressions you’re getting, plus the difference compared to last week. Swipe along and you’ll be able to see your reach and again, the difference within a week.

#7 | KEEP TRACK OF REPLIES AND COMMENTS
These are crucial to keep an eye on, because they let you know how interesting your audience is finding your posts. It’s just like with likes and favourites – they help you see what you need to alter or cut out of your strategy, and what social content is performing the best.
How to track it
I’m sure you’re used to this by now 😉 Head to Insights, then Posts. Scroll down to All posts published and in the drop-down menu, you want to select Reactions/Comments/Shares.

From here, you can see how many comments you’ve had. Again, if you want more details, click on each post link.

On Twitter, you can easily monitor your replies for each post through your notifications, but bringing up the whole host of data is a little trickier.
When you’re in Analytics, head to Tweets and if you scroll down on the right-hand side you’ll see a little graph detailing your replies. You can also click on each individual tweet within the table to view more engagement levels, including the amount of replies you got.

As we said earlier, in Squarelovin, head to Engagement and scroll down to see data about your comments.

#8 | WHAT CONTENT IS BEING SHARED?
You know as a blogger how you’re told you need to create high value content? Social shares reflect that value. The more your content is shared, the more your audience found it beneficial, interesting or had a strong connection to it. This means that your reach will be greater too.
How to track it
Head to Insights, then Posts. Scroll down to All posts published and in the drop-down menu, you want to select Reactions/Comments/Shares. In this section, you’re focusing on the shares.

On Twitter, go to Analytics, then Tweets and scroll down the right-hand side to see a graph detailing your retweets.

#9 | HOW MUCH WEBSITE TRAFFIC ARE YOU GETTING FROM SOCIAL MEDIA?
Your Google Analytics data can tell you not only how much traffic you’re getting from social media, but also how much you’re getting from each individual platform. This is really helpful for knowing what channels you need to focus on.
For instance, I focus on Twitter mainly, but earlier last year, my referral traffic from Pinterest started growing. So I started implementing a strategy and now it’s my biggest source of referral traffic every month without fail.
Like I said, you need access to Google Analytics to see this data. In your dashboard, scroll down the left-hand column to Acquisition, then Social and Overview.
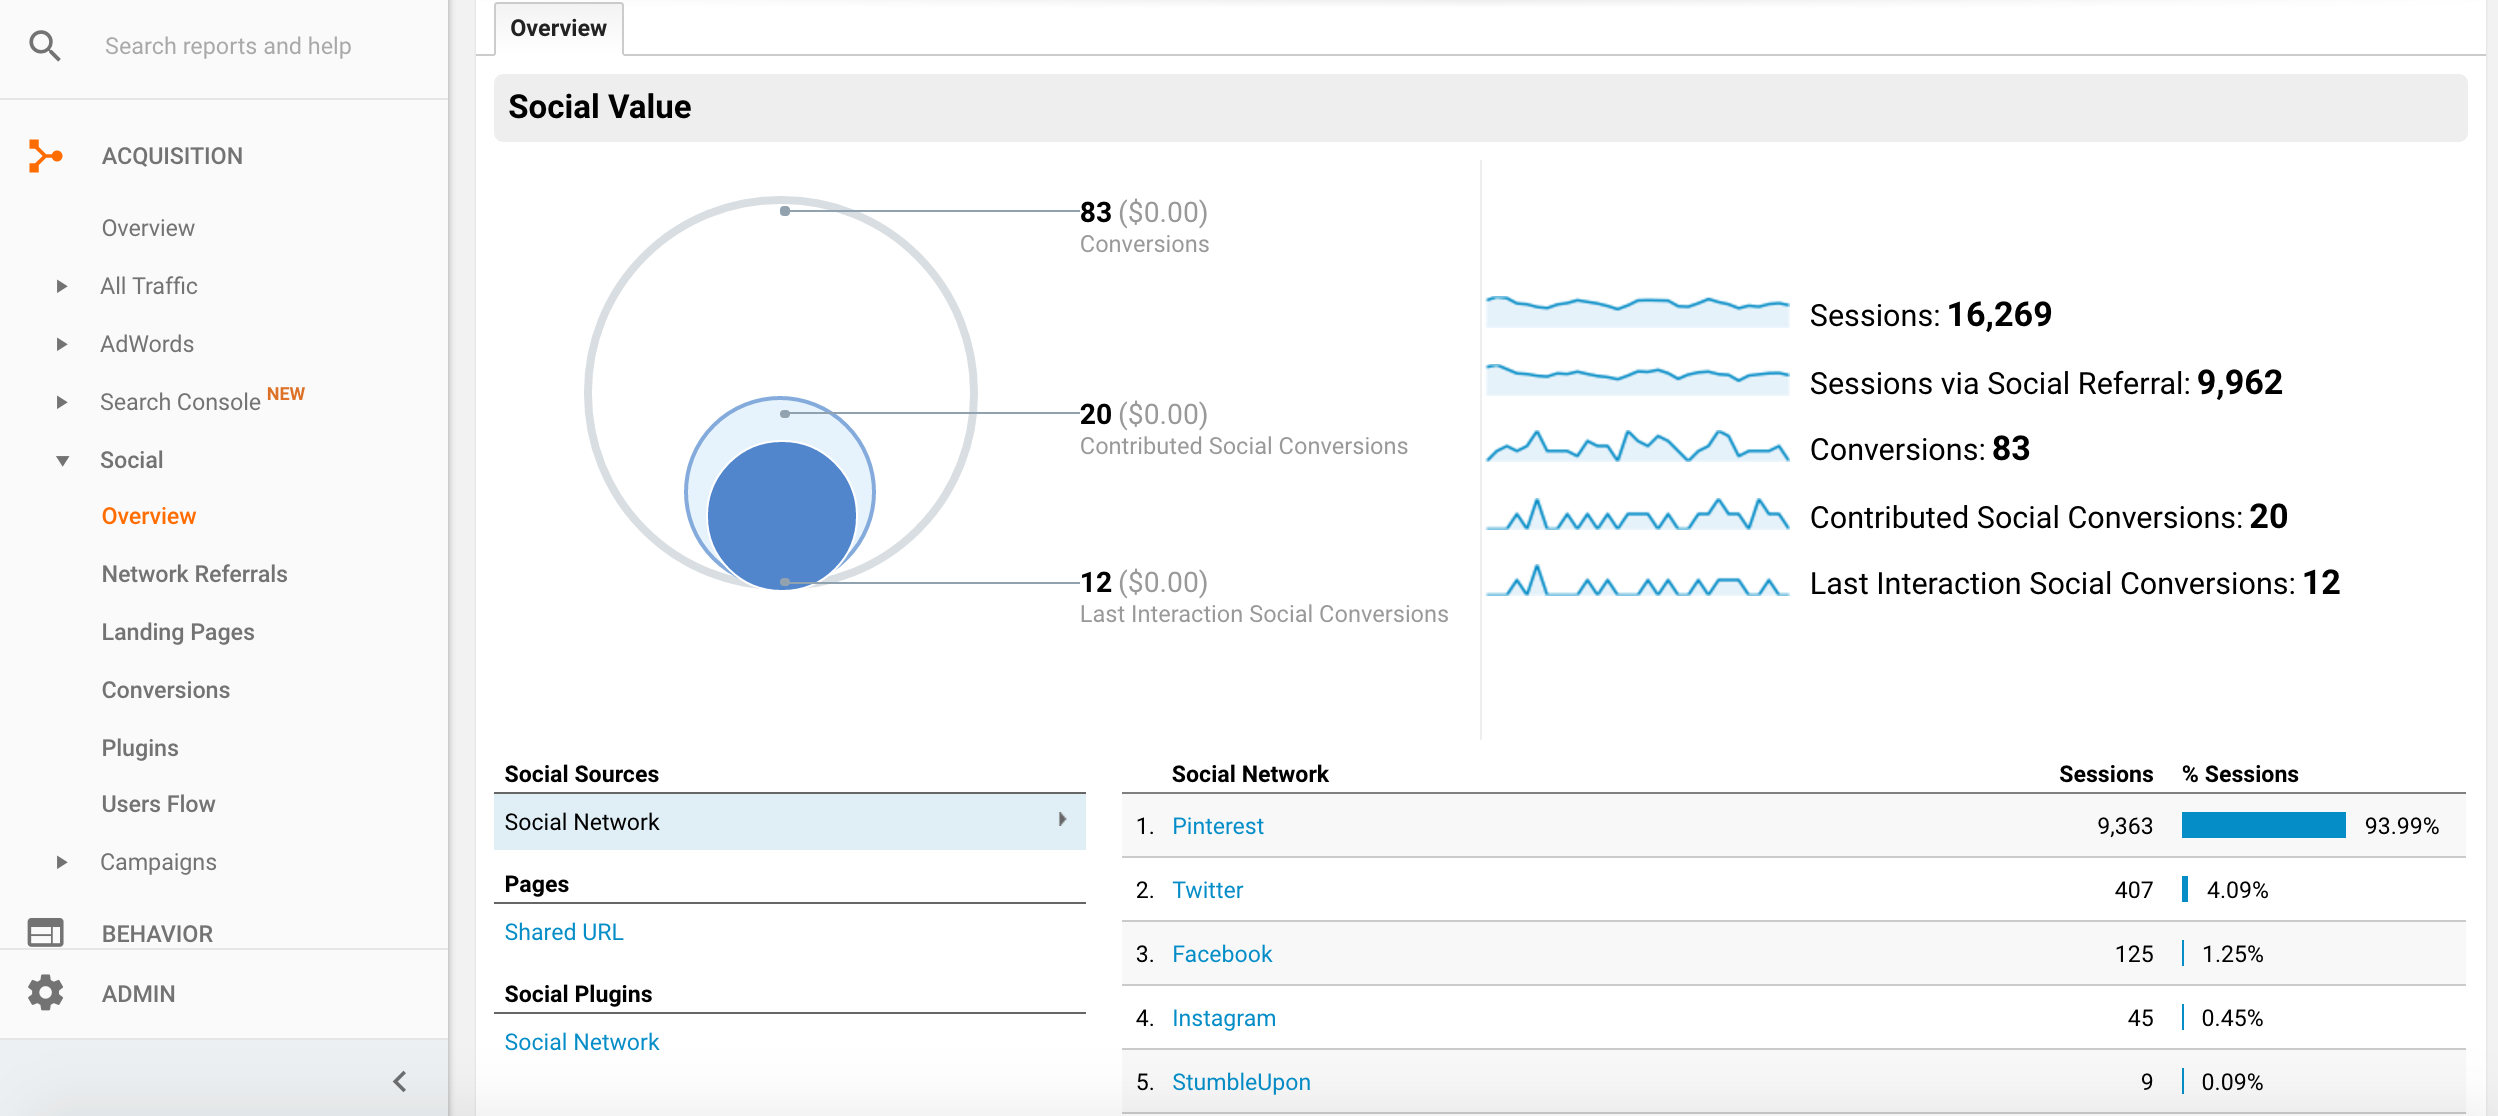
This gives you all the basic information you need to know, like how much traffic you’re getting from each social network, sessions, conversations and social conversations.
Go down one further in the menu to Network Referrals and you’ll see sessions, pageviews, average session duration and pages visited per session, ALL from your social content.

#10 | LOOK AT CLICK RATES
Click rates is getting a little more in depth when it comes to analytics and most people think they’re online important if you’re trying to generate revenue. This isn’t true. They’re all about conversions. So how your followers are engaging with you, why they’re engaging and what’s making them click on certain links.
How to track it
Now this can get fairly complicated for Facebook. In Posts in your Insights, you’ll see the number of post clicks for each post. This shows you which posts your fans found most engaging.
If you go to Actions on Page down the left-hand side, you’ll see click counts for all sorts of different things, including phone number, website and call to action.

Twitter gives you a neat little table again in your Analytics when you go to Tweets and scroll down the right-hand side.
I use a tool called bit.ly to track my link clicks as this also lets you customise your links too.

Use Instagram’s own analytics to track this. Scroll across the top navigation bar to see your website clicks plus the difference from the week before, and email clicks, plus the difference within a week.

A FINAL NOTE
It might seem like a lot, but keeping track of your social media metrics is crucial to monitoring your brand’s overall online presence. This will help transform your social strategy and enable you to create content that is targeted, personalised and totally engaging.
Now it’s your turn – do you monitor your social analytics? How much detail do you go into? Do you think you’ll let this information influence your strategy in the future?