
7 Important Metrics To Look At In Your Google Analytics Report
It’s no secret that your Google Analytics report is important. But you also need to know that there’s more to it than just looking at the stats every single month.
The biggest mistake people make (and one that I used to make) is taking in information but not acting on it. You need to take action, especially when it comes to your Google Analytics report, to evolve your strategy.
So I’m afraid I’m going to have to give you a little bit of homework to do, my friend.
Google Analytics isn’t just a tool to help you track how many people are coming to your site. It’s full of powerful information that you can use to grow your blog traffic and online presence as a whole.
I’m going to go over 7 important metrics to look at in your Google Analytics report...and it’s all free.
And if you're looking to track your improvements with your blog, be sure to start with this blog post checklist!
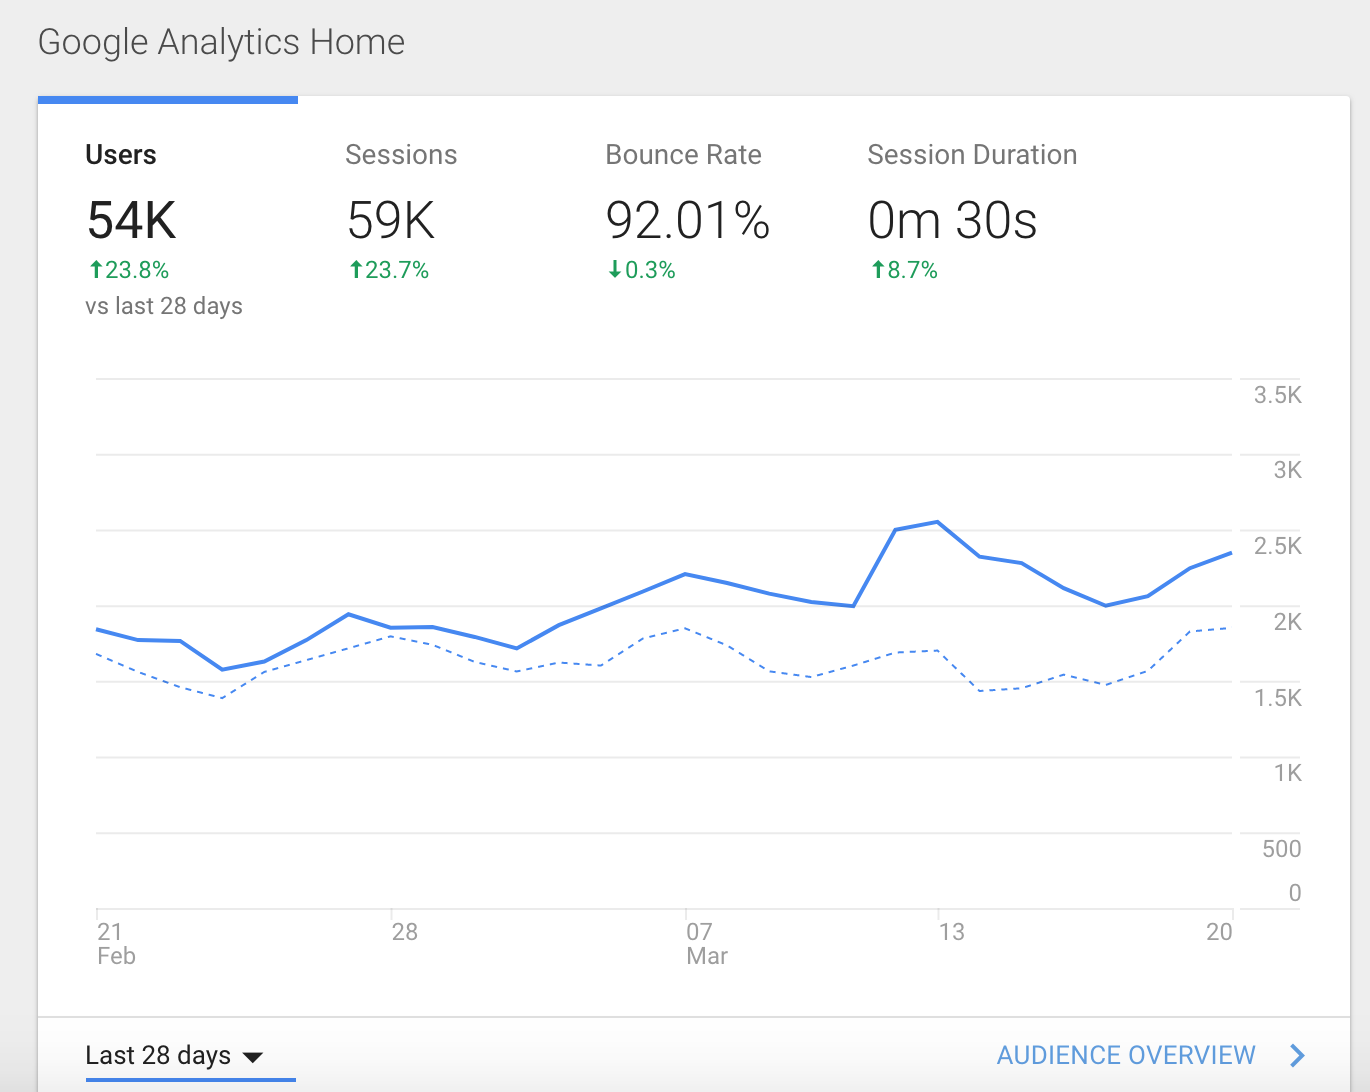
Before we get into it, I just want to draw your attention to your main Google Analytics dashboard. Here you’ll see an overview of the following:
Users
Sessions
Bounce Rate
Session Duration
These four things are always here, because these are the top four things you should be looking at every time you log in.
I just wanna’ let that sink in so you’ve got it.
This information basically tells you whether your metrics are moving up or down. It’s good to look at this across 30 days to try and get a clear picture.
So while I check in with those stats on a weekly basis, I also review the following list of metrics at the end of every months and this acts as my main Google Analytics report.
By analysing these metrics, I can then see how I’m going to take action to move forward. Sometimes it might be figuring out ways to keep people on my site for longer, it might mean more self-promotion, or it might be looking to see where my referrals are coming from and building those relationships.
Here are the metrics you need to pay attention to.
Note: set your date range to either the past month or the past 30 days.
#1 | USER LOCATION
When you go to Audience > Geo > Location, you can see a geographical breakdown of everyone who has visited your site.

When you scroll down, you can see a full list of the countries people are visiting from. This is helpful information to know for a couple of reasons.
First, it can help you figure out what time to publish your blog posts. For instance, I used to schedule blog posts for 7am GMT which is 3 am in Washington DC. And looking at my geo audience map, you can see that the biggest portion of my audience are in the US. So I recently changed my publishing times to 2 pm GMT which is 10 am in America, giving more people a chance of seeing my post.
Knowing the geographical location of your audience is a simple way to refine your strategy and grow your traffic.
And if you’re a business owner reading this, it’s even better. You can actually run a Google Adwords or Facebook ads campaign to target specific locations where your ideal audience is. It’s much more cost-effective this way and your Google Analytics report gives you all the information you need. Simple, right?
#2 | TRAFFIC SOURCES
Whenever I look at this for clients, I get super excited.
You want to go to Acquisition > Traffic > Channels and get that formula imprinted in your brain.
At a quick glance, it tells you how much of your traffic is coming from the following sources:
Organic search
Direct
Social
Referral
Email
Paid (if you run ads)

Most of these are pretty self-explanatory. The only one that’s a little vague is Direct traffic. This includes people typing your website into their browser, coming from a bookmark AND traffic from emails if they’re untagged. So watch out for that.
This part of your Google Analytics report tells you exactly where your users are coming from. So depending on what your focus is, you can refine and improve your strategy moving forward.
#3 | REFERRALS
You’ll find Referrals in the same section as Channels, you just need to click on a different tab. This tells you what specific websites are sending people to your website.

This is great information to take notice of, especially if you’re working on generating more backlinks and expanding your network. As you can see, it also lists social media sites people are visiting from, but you’ll also find all other sites in there that are linking to you.
Chances are you’ll probably see something you don’t know, so check them out. Maybe reach out and say thanks if they included you in a round-up...you never know where a connection might lead.
#4 | KEYWORDS
If you’re looking at upping your SEO game, this section is for you.
Under Acquisition > Campaigns > Organic Keywords, you’ll find so much useful information.

These right here are keywords that people have actually typed into Google to find you. And then they clicked on your site. Pretty cool, right?
It’s so important to constantly be working on your SEO. If you do this effectively, it can be such a great way of bringing new readers to your site.
And if you want to learn how to optimise your blog for SEO and double your pageviews, get your hands on this free Ideal Blog Post Checklist.
Honestly though, a key step in your blogging process should be to look at what words real people are using to get to your site. This is so valuable.
My list is very Instagram heavy at the moment as I have some blog posts about Instagram that are doing really well. But scroll further down and you’ve got “beginner blog ideas”, “best topics for starting a blog”, “blog post ideas for beginners” - they’re great keywords I want to be found for.
If you focus on writing about what people are actually searching for, your traffic will increase.
#5 | MOST POPULAR CONTENT
If you’re struggling for blog post ideas and don’t know what to create next, your best bet is to look at your top content. Head to Behaviour > Site Content > All Pages to see the content that is most popular with your audience.

My post about “how to use polls in Instagram Stories” has been popular for months now. This went viral through organic search and was published in October 2017. My Printables post which is number 4 went viral on Pinterest - and was published in May 2016.
That’s why this part of your Google Analytics Report is so great, because it shows you what your readers want to see more of. If you love writing about a certain topic but no-one is reading it, that should be a big sign for you. Write what people want to see and you’ll increase your traffic.
Each month, check in with your top 10 most popular posts. If any new ones appear, go through them and give them another proofread. Could you format it a bit better? Improve the headline? Add more links?
This little bit of maintenance on old blog posts can be so useful when it comes to increasing your organic traffic. These are the posts that people are visiting the most, so make them as valuable as you can. Capitalise on the amount of traffic they bring it.
#6 | PAGEVIEWS
I know a lot of people say blogging isn’t about the numbers. But pageviews is a great metric to see whether your blog is getting more traffic on a monthly basis.
You can see this in Audience > Overview.
You want to keep a track of this because it shows you the total amount of views your blog has had during a given time. It’s just one number, but a necessary place to check out your progress each month.
#7 | BOUNCE RATE
Ah bounce rate. This can be good or it can be bad. It really depends on a lot of other metrics in your Google Analytics report. You can look at the overall bounce rate for your site, or you can dig even deeper and look at the bounce rate for each of your pages or blog posts in particular.
Sometimes your bounce rate is high for your blog posts because someone finds what they want and that’s it. But sometimes it’s high because your site takes too long to load, or people don’t find what they expect.
I hope you learnt something about Google Analytics today, but more than that, I hope it gave you more confidence with your Google Analytics report. Now you can start taking action!
And remember, if you want track the improvements you make, start by using this blog post checklist to double your pageviews.
Do you feel more confident with Google Analytics now? Let me know in the comments!
